Report Purpose
The Summary of Data Submitted report allows a user to view the cases submitted to the registry by date, type and other criteria.
How to Access
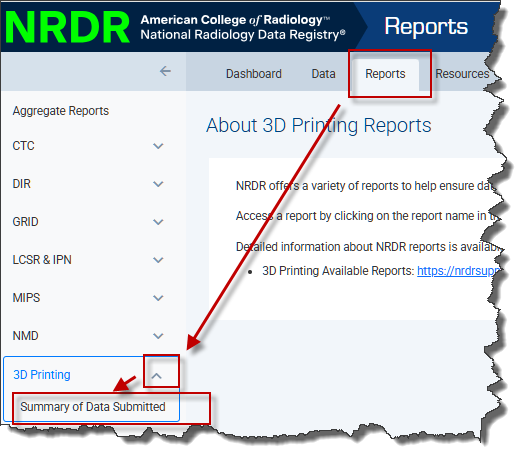 To view the report:
Click the Reports tab in the top menu from any page in the NRDR portal
Click the drop-down arrow next to 3D Printing in the left menu.
Click Summary of Data Submitted.
Report Features
The report is comprised of three dashboards:
Summary of Data Submitted: The report opens to this dashboard. Select your Corporate Account (and the corresponding facility) and click the Apply button. Then enter a date range to generate the report.

- The Printers pie chart shows the number of cases for each printer. Hovering over each portion of the chart provides information for each.
- The Body Region horizontal bar chart shows surgical procedure counts. Hovering over each provides the exact count.
- The Cases by Date vertical bar chart shows the cases submitted by the date received. Hovering over each provides the exact count.
- The Facilities table shows the number of cases by facility. Clicking on the facility name will show facility-specific data.
Completion Rates: The tab shows for each facility selected the percentage of exams submitted that have complete case data entered (includes only required fields).
- Details for each of the completion categories can be found in the 3D Printing Data Dictionary.

Effort Matrix: The table and box-and-whisker plots provide status for effort duration by procedure phase for clinicians and non-clinicians.

Note: a clinician or non-clinician may not have effort data for all procedure phases. Similarly, a single procedure phase may not have effort data for both clinician and non-clinician staff types.
- Each dot in the box-and-whisker plot represents a single exam. Hover your curser over the dot to see exam details.
